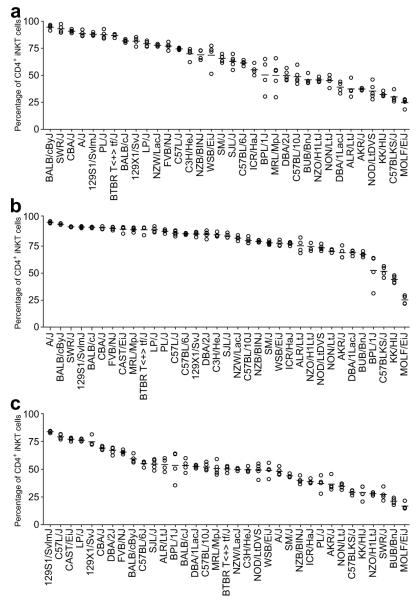
Figure 2.
Proportions of iNKT-cells that also express CD4. Red blood cell-depleted single cell suspensions were obtained from peripheral blood (A), spleen (B), and thymus (C) of each inbred mouse strain. iNKT-cells were identified by a staining cocktail containing CD1d tetramers, anti-TCRβ, and anti-CD4. The results are presented as the percentages among total iNKT-cells. Each symbol represents one mouse (4-5 mice per strain). The horizontal bar indicates the mean of each strain.

