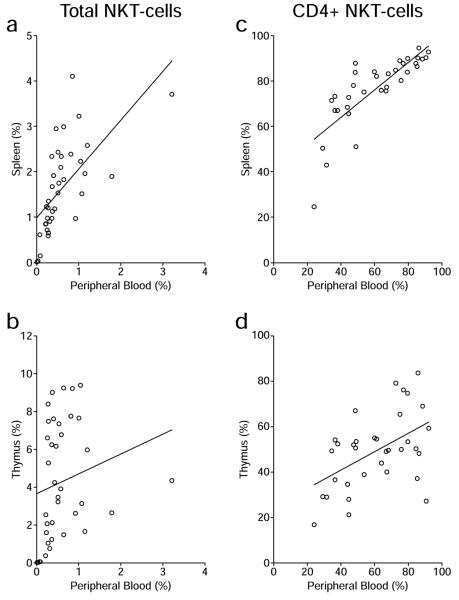
Figure 3.
Correlation of iNKT-cells in peripheral blood and lymphoid organs. Correlation of the frequencies of total iNKT-cells (A and B) or the percentages of CD4-expressing iNKT-cells (C and D) between peripheral blood and the spleen (A and C), and peripheral blood and the thymus (B and D) was determined by the Pearson correlation coefficient analysis. The line in each plot represents the best linear fit.

