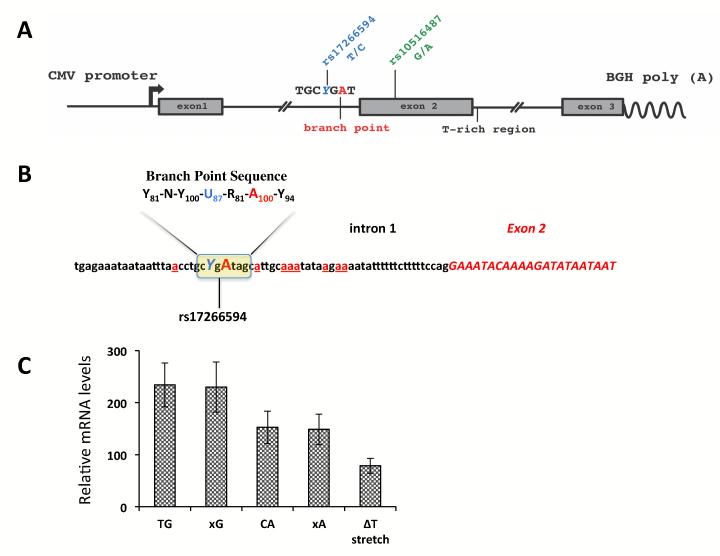
Figure 1.
The minigene analysis of BANK1 exon 2 splicing.
(A) The schematic structure of the BANK1 minigene constructs cloned in the pcDNA3.1 vector.
(B) The putative branch point sequence in intron 1. The invariant adenosine is shown in capital red, the SNP rs17266594 is shown in blue. The exonic sequence in presented in italic capital letters colored in red. Alternative cryptic branch point adenosines are shown in red and underlined. The consensus branch point sequence is shown on top with frequency scores in subscript 12.
(C) mRNA expression levels for the full-length isoform produced from minigenes with particular haplotypes. Expression was normalized to the levels of the neomycin mRNA transcribed from the same plasmid. The values represent the means of 4 independent experiments +/−SD. TG vs. CA, p=0.0293. The constructs designated as xG and xC contain mutated branch point sequence, the ΔT stretch construct is similar to the TG construct but lacks the poly (T) stretch downstream of exon 2.

