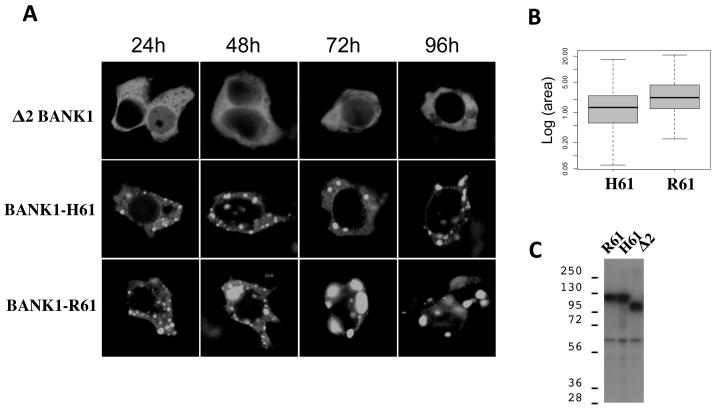
Figure 4.
Time-course analysis of protein complex formation in cells expressing different isoforms of BANK1.
(A) Confocal images of HEK293 cells transfected with plasmids expressing BANK1 isoforms tagged at the C-terminus with green fluorescent protein. Cells were analyzed 24 hours post-transfection. The both full-length Bank1 isoforms, BANK1-R61 and BANK1-H61, form discrete protein complexes in the cytoplasm while the short isoform Δ2 is homogeneously distributed in the cytoplasm. Cells expressing the BANK1-R61 isoform show larger spots compared to the cells expressing the BANK1-H61 isoform.
(B) Measurement of the cytoplasmic dots using the ImageJ program. The analysis was done blindly using coded digital pictures corresponding to 9 different transfections. Two different constructs for each isoforms were used, one tagged with CFP and the other with GFP.
(C) Western blot of cells transfected with BANK1 isoforms (BANK1-R61, BANK1-H61, and Δ2-BANK1) tagged with FLAG-epitope at the N-terminus and probed by anti-FLAG antibody. The intensity of the bands indicates equal expression of BANK1 in transfected cells. The band above 56 KDa is a nonspecific signal detected also in untransfected cells.

