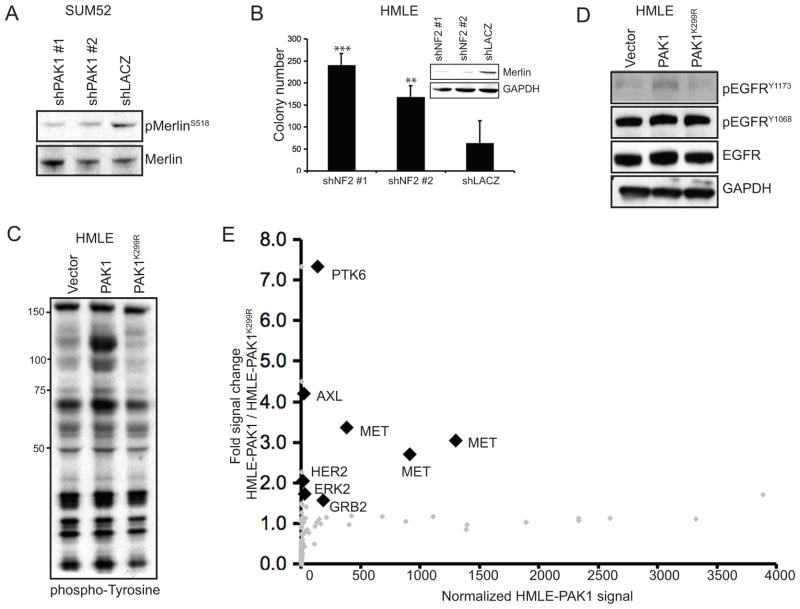
Figure 6. PAK1 expression inhibits Merlin function, subsequently upregulating phospho-tyrosine levels.
A. Phosphorylation status of MerlinS518 in SUM52 cells expressing PAK1- or lacZ-specific shRNAs. B. Anchorage-independent colonies formed by HMLE expressing NF2-or lacZ-specific shRNAs. Merlin protein levels are shown. ***p-value = 0.0002, **p-value = 0.0059. C–D. Immunoblots showing overall phospho-tyrosine levels (C) or phospho-tyrosine levels of EGFR at Y1173 and Y1068 (D) in HMLE cells expressing a control vector, PAK1 or PAK1 K299R. E. Luminex assay showing normalized phospho-tyrosine signals of TKs and associated proteins in HMLE-PAK1 (x-axis) and the fold phospho-tyrosine signal increase in HMLE-PAK1 when compared to HMLE-PAK1K299R (y-axis). Each diamond (gray and black) represents individually distinct antibodies. Analytes considered positive (>10) and showing significant (1.5) fold increase in signal are shown as black diamonds. All labeled analytes (black diamonds) scored in lysates harvested in normal growth conditions.

