
Fig. 1.
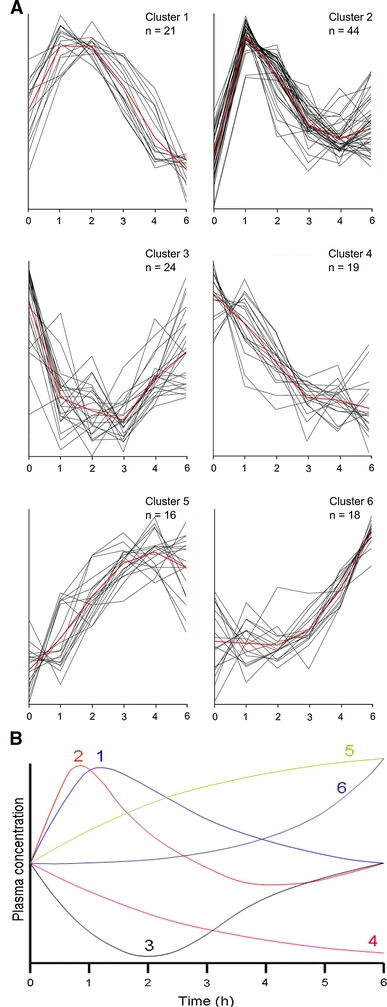
The six different observed postprandial time course profiles. a The time cluster profiles represented by the 142 different plasma metabolites and proteins with a significant effect of time. The red line represents the average cluster time profile. The x-axes were expressed as time (hours), the y-axes were expressed as relatively scaled concentrations. Time profile cluster 1 represented 21 plasma parameters with a classical absorption profile, reaching maximum values after 1–2 h, followed by a continued reduction towards minimal values at the final (6 h) time point. Time profile cluster 2, including 44 parameters, was similar to cluster 1, with the main difference that parameters in cluster 2 reached minimum values around 4 h after postprandial challenge. Thus, the time profile clusters 1 and 2 mainly differ in the duration of the response (4 or 6 h after postprandial challenge). Time profile cluster 3 represented the parameters that decreased upon the PCT, with a subsequent recovery phase. The average time required to reach lowest plasma concentrations is 2–3 h. This cluster contained 24 parameters with a significant time effect. Time profile cluster 4 (19 parameters) included parameters that steadily decreased during the 6 h time course. Time profile cluster 5 represented 16 plasma parameters that increased during most of the 6 h time course. The average time required to reach highest plasma concentrations was ~4 h. Finally, time profile cluster 6 included 18 parameters with a continuous increase in plasma concentration after an initial lag phase of approximately two hours. b The different time profile clusters summarized in one figure (Color figure online)