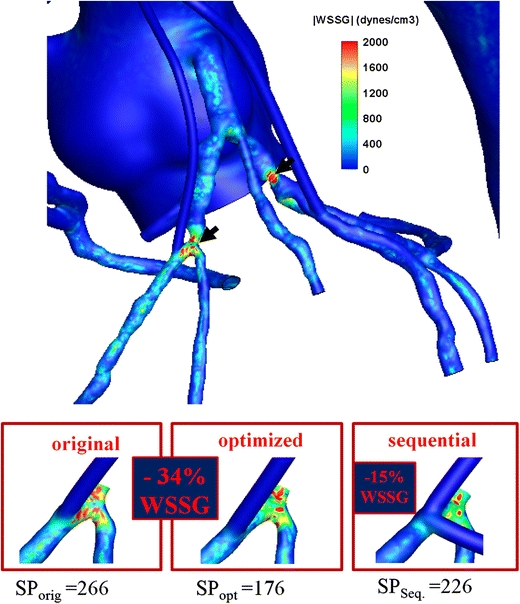
FIGURE 7.

Spatial variation of wall shear stress (WSS) is quantified using WSS gradient (WSSG) (top). Elevated WSSG was found in proximity to the bifurcations and anastomosis zones (marked with black arrows), which are prone to intimal hyperplasia and atherosclerosis development.24 3D evaluation of the optimized LIMA graft indicated significant WSSG relief (~34%) in agreement with the 2D simulations (bottom). WSSG was lowered by 15% proximal to LAD and diagonal bifurcation for the sequential graft in comparison to the original graft
