
Fig. 1.
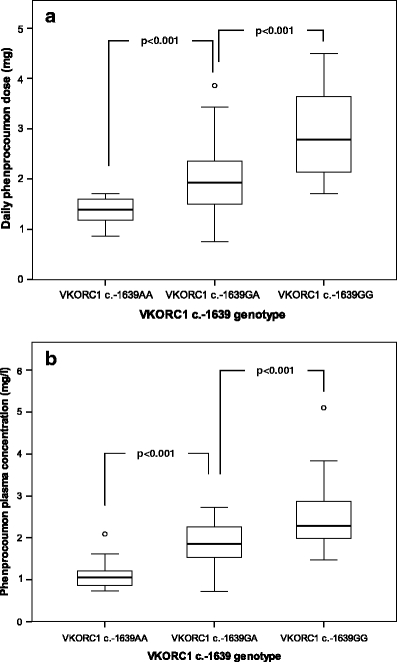
a Daily phenprocoumon doses according to VKORC1 c.-1639 genotypes. The median daily phenprocoumon doses are depicted within the boxes. b Phenprocoumon plasma concentrations according to VKORC1 c.-1639 genotypes. The median daily phenprocoumon plasma concentrations are depicted within the boxes. In a and b the boxes end at the 25th and 75th percentiles. The whiskers extend to the farthest points that are not outliers. Outliers are depicted as open dots