
Fig. 2.
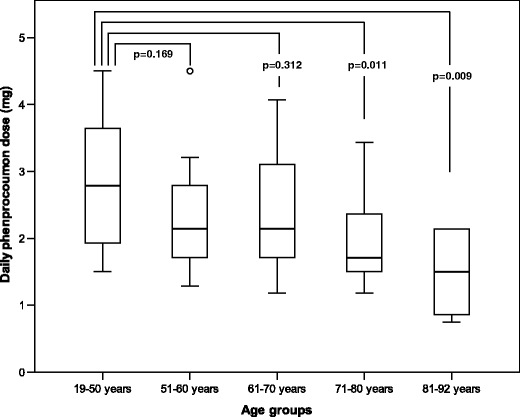
Daily phenprocoumon doses in different age groups. Median doses are depicted within the boxes. The boxes end at the 25th and 75th percentiles. The whiskers extend to the farthest points that are not outliers. Outliers are depicted as open dots