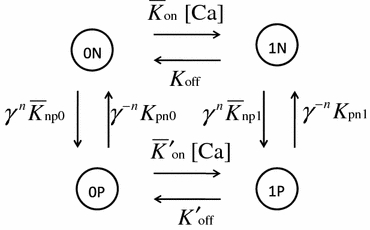
The cooperative four-state Markov model. States are coded with the combination of the Ca binding state (0: not bound, 1: bound) and conformation for cross-bridge formation (P: permissive, N: non-permissive). Transitions among the states are governed by the rate constant adjacent to each arrow. To introduce the co-operative behavior for the transition between states P and N, the factors γ
n and γ
−n are multiplied by the transition rates from N to P and P to N, respectively, where n is the number of neighboring MHs in the P-state. The overlines for transition rates \documentclass[12pt]{minimal}
\usepackage{amsmath}
\usepackage{wasysym}
\usepackage{amsfonts}
\usepackage{amssymb}
\usepackage{amsbsy}
\usepackage{mathrsfs}
\usepackage{upgreek}
\setlength{\oddsidemargin}{-69pt}
\begin{document}$$ \bar{K}_{{{\text{np}}0}},\;\bar{K}_{{{\text{np}}1}} ,\;\bar{K}_{\text{on}} $$\end{document} and \documentclass[12pt]{minimal}
\usepackage{amsmath}
\usepackage{wasysym}
\usepackage{amsfonts}
\usepackage{amssymb}
\usepackage{amsbsy}
\usepackage{mathrsfs}
\usepackage{upgreek}
\setlength{\oddsidemargin}{-69pt}
\begin{document}$$ \bar{K}^{\prime}_{\text{on}} $$\end{document} indicate that these rates are modified according to the SL. [Ca] denotes the free Ca concentration

