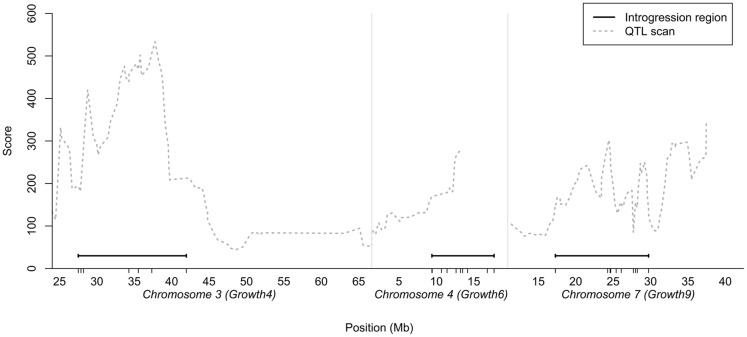
Figure 1.
Chromosomal segments on chicken chromosome 3, 4, and 7 selected for introgression plotted in relation to the statistical support-curve for the corresponding QTL in these regions from a QTL replication study in a nine generation Advanced Intercross Line (Besnier et al., 2011). The short vertical lines on the x-axis show the locations of the markers genotyped in the regions.

