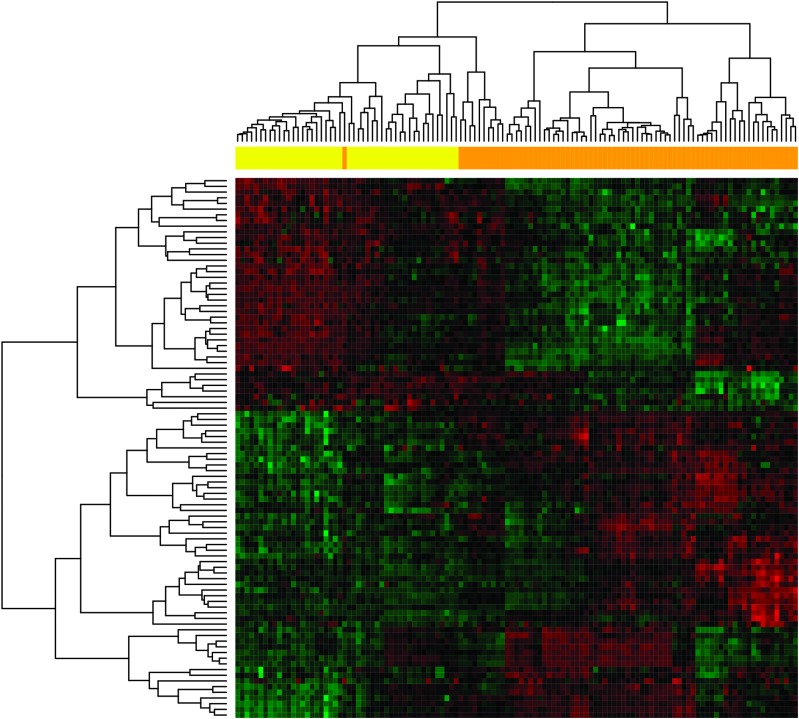
Fig. 1.
Hierarchical clustering of 74 familial ovarian cancer cases and 47 cancer-free relatives based on age-corrected microRNA expression levels. In the clustering heat map, red indicates upregulated, whereas green indicates downregulated. In the sample clustering dendrogram, orange indicates samples from cancer patients, whereas yellow indicates samples from cancer-free controls.

