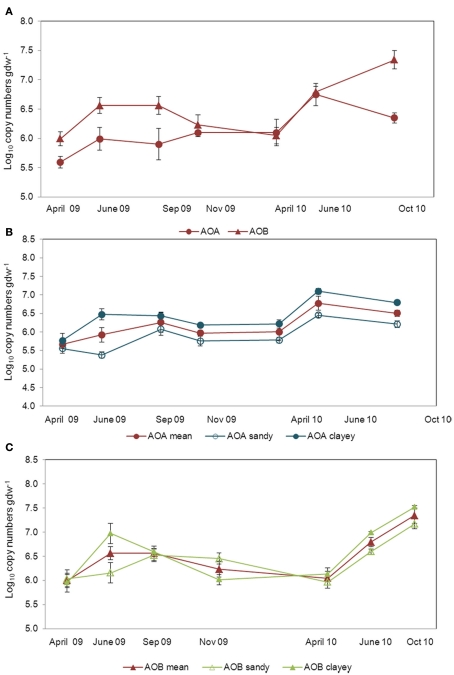
Figure 2.
Amplitude of variation in the community size of AOA and AOB. Fluctuations in the community size were determined by real time quantification (qPCR) of amoA gene as a mean of all soils [(A); ΔtAOA = 1.21 ± 0.08; ΔtAOB = 1.35 ± 0.14] and separated in sandy and clayey for both AOA [(B); Δtsandy = 1.18 ± 0.02; Δtclayey = 1.25 ± 0.02] and AOB [(C); Δtsandy = 1.45 ± 0.30; Δtclayey = 1.26 ± 0.08]. Bars are SE.

