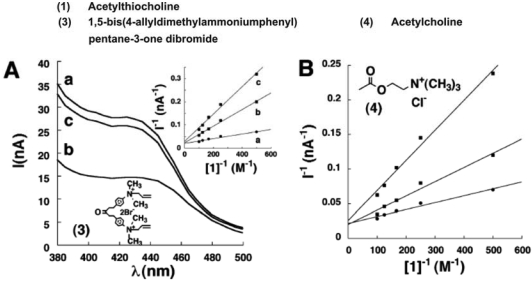
Figure 9.
(A) Photocurrent spectra corresponding to the CdS/AChE system in the presence of acetylthiocholine, 10 × 10-3M (a) without the inhibitor; (b) upon addition of 10 × 10-6 M inhibitor; (c) after rinsing the system and excluding of the inhibitor. Inset shows the Lineweaver-Burke plots corresponding to the photocurrent at variable concentrations of acetylthiocholine, in the presence of inhibitor. (a) 0 × 10-6 M, (b) 10 × 10-6 M, (c) 20 × 10-6 M. Data were recorded in 0.1 M PBS, pH = 8.1, under argon atmosphere. (B) Lineweaver-Burke plots corresponding to the photocurrent at variable concentrations of acetylthiocholine, in the presence of (a) 0 × 10-3 M, (b) 1 × 10⁻³ M, (c) 2 × 10⁻³ M of acetylcholine. Data were recorded in 0.1 M phosphate buffer, pH = 8.1, under argon atmosphere (reproduced with permission from Pardo-Yissar et al. [35]).

