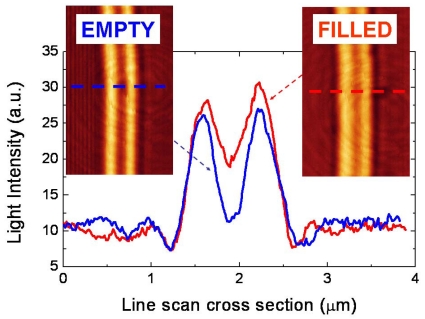
Figure 6.
Confocal microscope intensity profiles of a Si3N4 slot-waveguide before isopropanol droplet deposition (blue line) and after isopropanol droplet evaporation (red line). Intensity profiles were taken along the dotted lines shown in the corresponding laser scanning confocal microscope images. Courtesy of M. Holgado (Centro Láser-Universidad Politécnica de Madrid).

