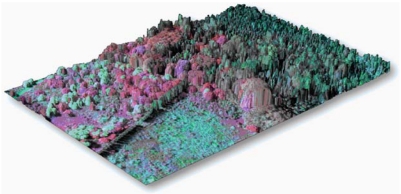
Figure 3.
Demonstration of the precision co-alignment and integration of data collected by active (LiDAR) and passive (hyperspectral) remote sensing. This image was collected by the Carnegie Airborne Observatory over a site in Hawaii. The color-coding highlights variation among canopy species and their chemical properties both derived from the hyperspectral data. In this particular example, highly invasive species with unique chemical signatures are shown in red and pink colors, whereas native hardwood forest canopy species are shown in greens and blues. The embedded LiDAR data indicates the height and 3-D structure of each tree crown on the landscape.

