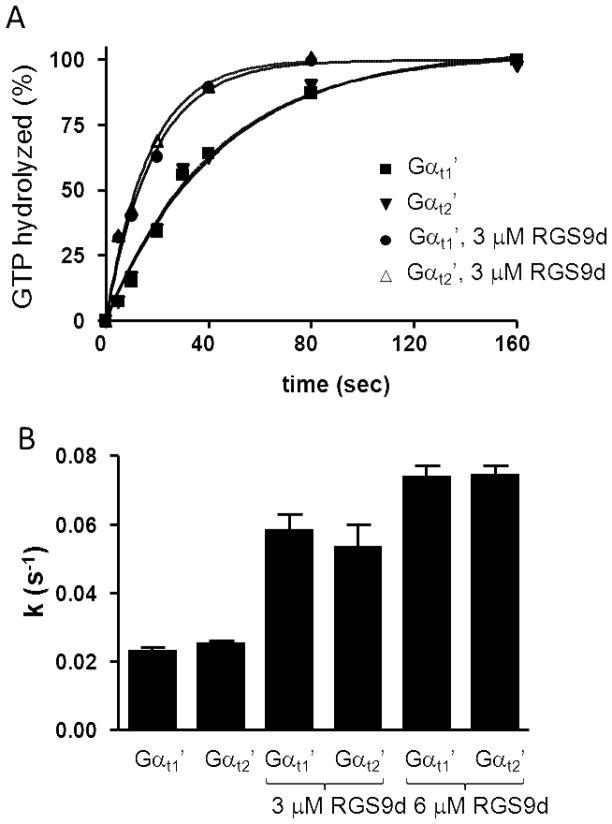
Figure 6. Single turnover GTPase assays of Gαt1′ and Gαt2′. Effects of RGS9d.
(A) Single-turnover GTPase activity measurements were carried out in suspensions of uROS membranes (10 μM rhodopsin) reconstituted with chimeric Gαt subunits (1 μM) and Gβ1γ1 (1 μM). Where indicated, RGS9d was added. Reactions were started with the addition of 100 nM [γ-32P]GTP and free 32Pi was measured by liquid scintillation. Results from one of three similar experiments are shown. (B) The kcat values (s−1) (mean±SE) for GTP hydrolysis by chimeric Gαt-proteins were calculated from three experiments such as shown in A.

