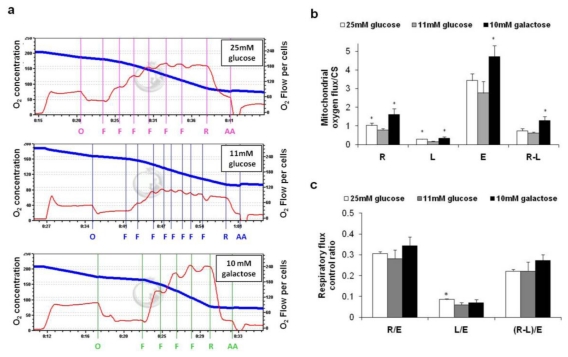
Figure 2.
Analysis of oxygen consumption in intact cells. Intact cells were analyzed in complete medium as described in the Methods. (a) Representative recordings of oxygen concentration [nmol/mL] (blue line) and oxygen flow [pmol/(s × 106)] (red line) measured by high resolution respirometry and corrected for instrumental background consumption. Abbreviations denote inhibitors and uncoupler added into the chamber (O-Oligomycin, F-FCCP, R-Rotenone, AA-Antimycin A) at the concentrations specified in the Materials and Methods; (b) Respiratory data [pmol/(s × 106)], corrected for the rotenone/antimycin A insensitive respiration, were normalized to the mitochondrial mass expressed as CS activity (IU/106 cells). Metabolic states: R-Routine, L-Proton Leak (calculated as the oligomycin-insensitive respiratory rate), R-L (calculated as the difference between the routine and the leak respiration), E-Maximum electron transport system (ETS) capacity (calculated as the maximal respiratory rate in the presence of FCCP). Values are means of three different experiments (bars represent s.d.), * p < 0.05 compared with HepG2 cultivated in the presence of 11 mM glucose; (c) Normalized respiratory flux control ratios: R/E ratio was calculated as the routine respiration (R) over the maximum ETS capacity (E); L/E was calculated as the leak respiration (L) over the maximum ETS capacity (E); and (R-L)/ E gives the fraction of respiration vs. the maximum ETS capacity that is used under routine conditions to produces ATP, referred to as phosphorylating respiration. Values are means of three different experiments (bars represent s.d.), * p < 0.05 compared with HepG2 cultivated in the presence of 11 mM glucose.

