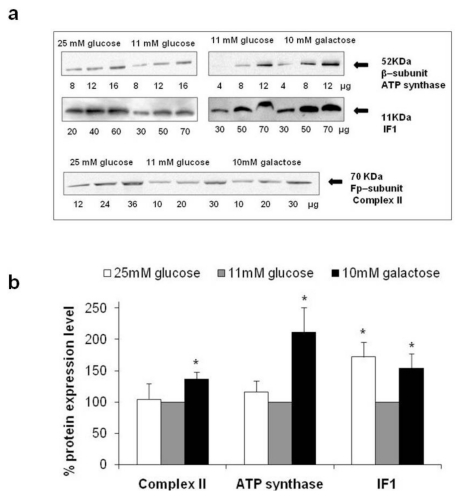
Figure 3.
Analysis of Complex II, ATP synthase and Inhibitor Factor 1 (IF1) expression level (a) Typical appearance of the immunoreactive bands for the Fp subunit of Complex II, the β subunit of ATP synthase, and IF1 obtained by Western blotting mitochondria from HepG2 cultivated in different glucose concentration; (b) Expression levels (%) of Complex II, ATP synthase, and IF1 in mitochondria from HepG2 cultivated in high and no glucose conditions compared to the expression levels detected in cells grown in 11 mM glucose, considered as 100%. For quantification purposes and as loading control, a linear relationship was verified between the band intensities (densitometric analysis) and the protein quantities loaded into the gel to ensure non-saturating conditions and high reproducibility. Values were inferred on the basis of the slope of the straight line and are means of three different experiments (bars represent s.d.); * p < 0.05.

