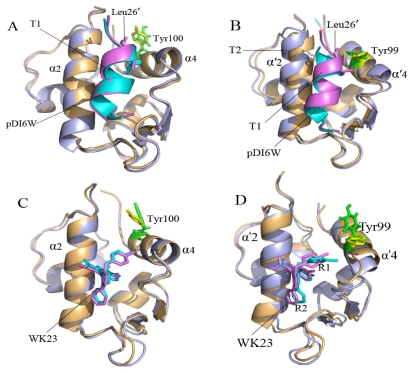
Figure 4.
Crystal structures were superimposed on the average structure from the last 500 ps of molecular dynamics simulation at an interval of 10 ps, (A) for the pDI6W-MDM2 complex; (B) for the pDI6W-MDM2 one; (C) for the WK23-MDM2 one; and (D) for the WK23-MDMX one. In the average structure, protein, inhibitor and Tyr100 (Tyr99) are shown in light orange, cyan and green, respectively. In the crystal structure, the protein, inhibitor and Tyr100 (Tyr99) are displayed in light blue, violet and yellow. The residue Leu26′ is from pDI6W and second structure labeled by α′ belongs to MDMX. T1 represents the residues 49–51 in MDMX and T2 indicates the residues 24 and 25 in pDI6W.

