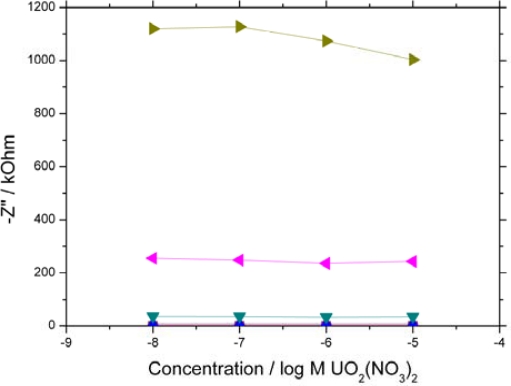
Figure 2.
Dependence of imaginary component of impedance on uranyl ion concentration. The JG-A12 SLP based sensors were exposed to UO2(NO3)2 and stirred continuously for 15 mins before a 30 min equilibration period. EIS scans were performed in 10 mM PBS at 0 V vs. Ag/AgCl at a perturbation of 10 mV. The signals at (▪ 10 kHz,
 1 kHz,
 100 Hz,
 10 Hz,
 1 Hz,
1 Hz,
 0.1 Hz) are shown. 10 kHz – 100 Hz all overlay each other close to zero due to the system exhibiting high resistive and low capacitive behaviour at high frequency.

