
FIGURE 3.
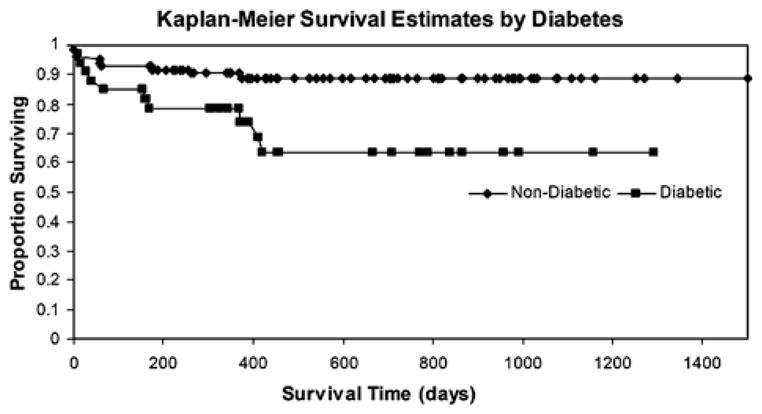
Kaplan-Meier survival curves for patients with and without diabetes. Unadjusted P values for log-rank Kaplan-Meier curve censored at day 30 (P=0.232), day 365 (P=0.076), and day 1095 (P=0.006).
Official websites use .gov
A
.gov website belongs to an official
government organization in the United States.
Secure .gov websites use HTTPS
A lock (
) or https:// means you've safely
connected to the .gov website. Share sensitive
information only on official, secure websites.
Kaplan-Meier survival curves for patients with and without diabetes. Unadjusted P values for log-rank Kaplan-Meier curve censored at day 30 (P=0.232), day 365 (P=0.076), and day 1095 (P=0.006).