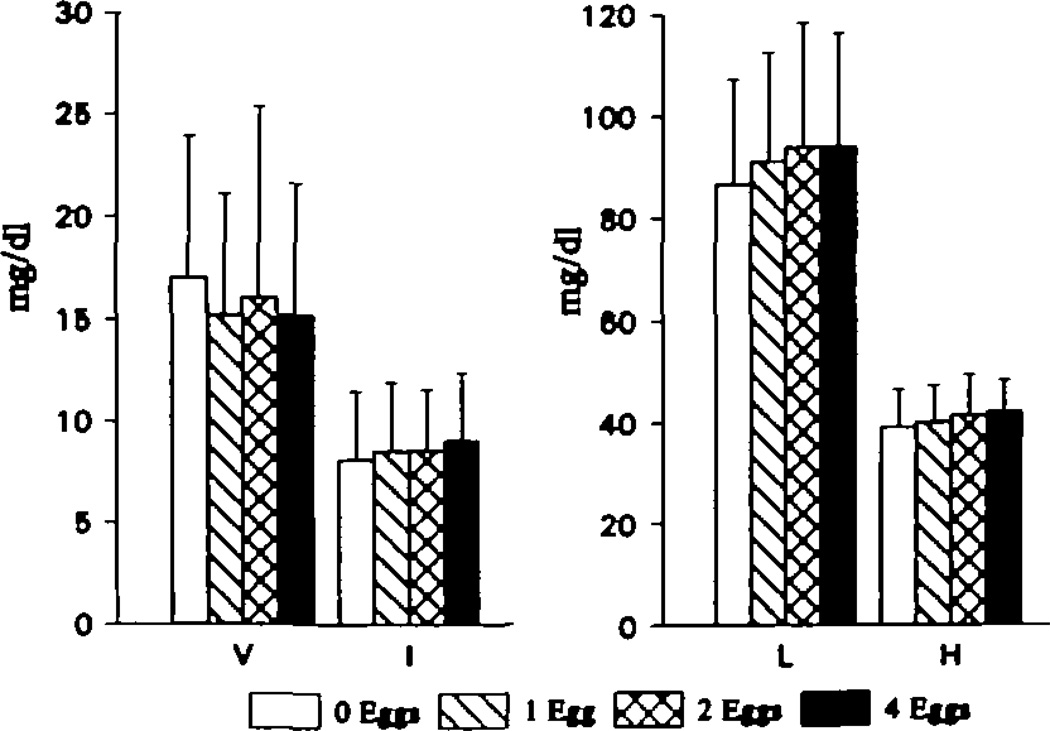
Fig 3.
Bar graphs show cholesterol concentrations in individual lipoproteins isolated by ultracentrifugation. Very-low-density lipoprotein (V) and intermediate-density lipoprotein (I) levels are depicted in the left panel and low-density lipoprotein (L) and high-density lipoprotein (H) levels in the right panel. Low- and high-density lipoprotein cholesterol concentrations increased with increasing dietary cholesterol intake (P < .05). To convert milligrams per deciliter cholesterol to millimoles per liter, multiply by 0.02586.

