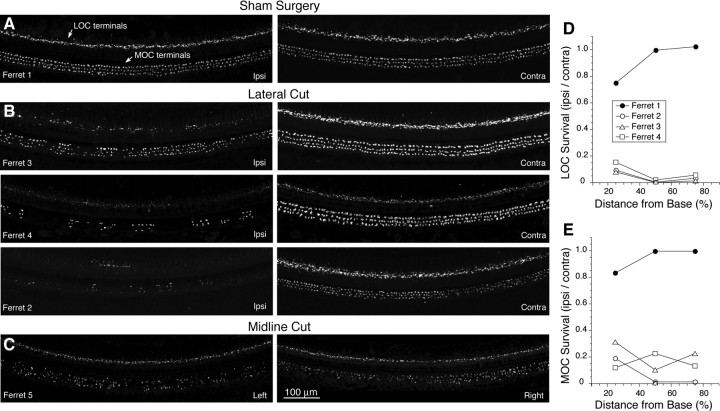
Figure 4.
Degree of de-efferentation in each of the OC lesions cases. A–C, Place-matched images of cochlear whole mounts immunostained for synaptophysin. Each row of images shows cochlear regions 25% of the distance from the basal end: Ipsi denotes the ear on the same side as the lateral lesion; contra, the opposite. Each image is the maximum projection of a z-stack of confocal images spanning the entire height of the organ of Corti. Scale bar in C applies to all images. D, E, Quantification of the degree of de-efferentation for the LOC system (D) or the MOC system (E) in each of the cases with an attempted lateral lesion. Total volumes of all labeled terminals were measured in image stacks such as those pictured in A–C: degree of de-efferentation was estimated by dividing the data from place matched image stacks from the two sides of each case.

