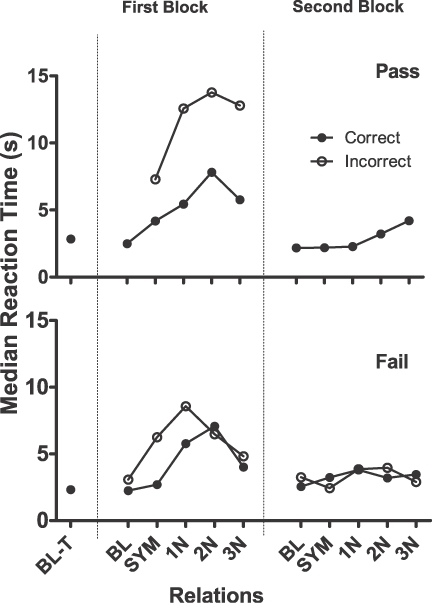
Fig 5.

Median reaction times of correct and incorrect responses plotted as functions of the type of relation (x-axis). Data within each panel are separated by the terminal baseline training trials and the first and second test blocks. The two panels separate reaction times of participants who did and did not form equivalence classes. Data are aggregated across groups.
