
Fig. 3.
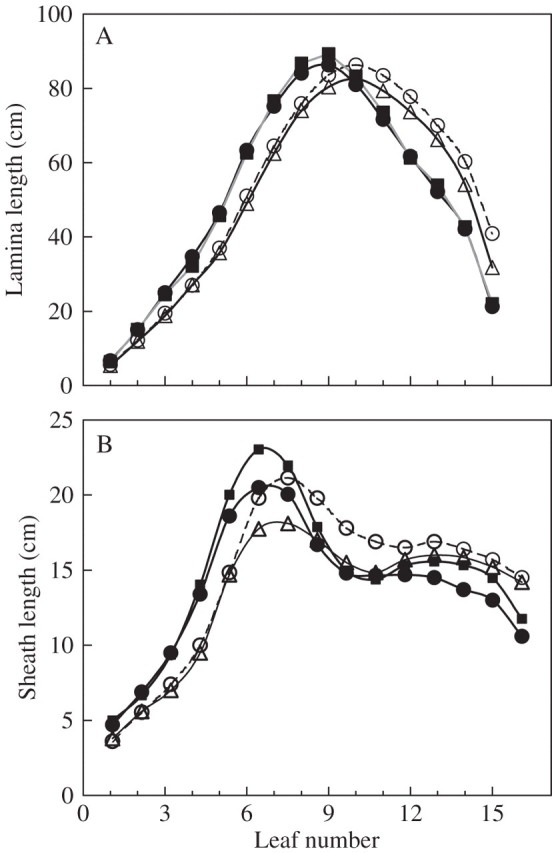
Final length of (A) laminae and (B) sheaths of successive phytomers along the shoot. Data are for ‘Déa’ at normal density (open circles) and high density (filled cicles), for ‘Nobilis’ at normal density in 1998 (triangles) and ‘Déa’ at high density in 1999 (squares). Confidence intervals (±2 s.e.) are smaller than the size of the symbols.