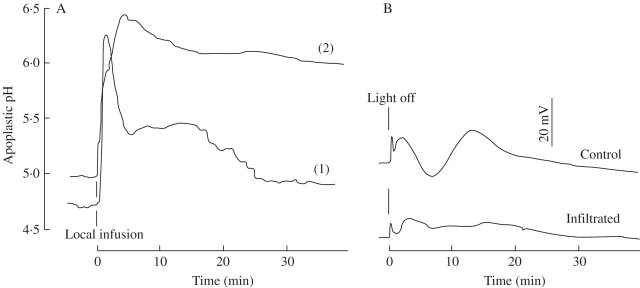
Fig. 3.
Apoplastic pH of barley leaves responding to infiltration. (A) Local infiltration through nanolitre pressure infusion with a solution that comprised 5 mm KCl, 0·1 mm CaCl2. Curve 1: only the immediate area around the measuring site was infiltrated, as detected by microscopic observation. Curve 2: a larger area was infiltrated. (B) Voltage responses to a ‘light off’ test following leaf infiltration according to pattern 2, or without infiltration (control). Representative curves of three equivalent tests each. For experimental details, see Materials and Methods.

