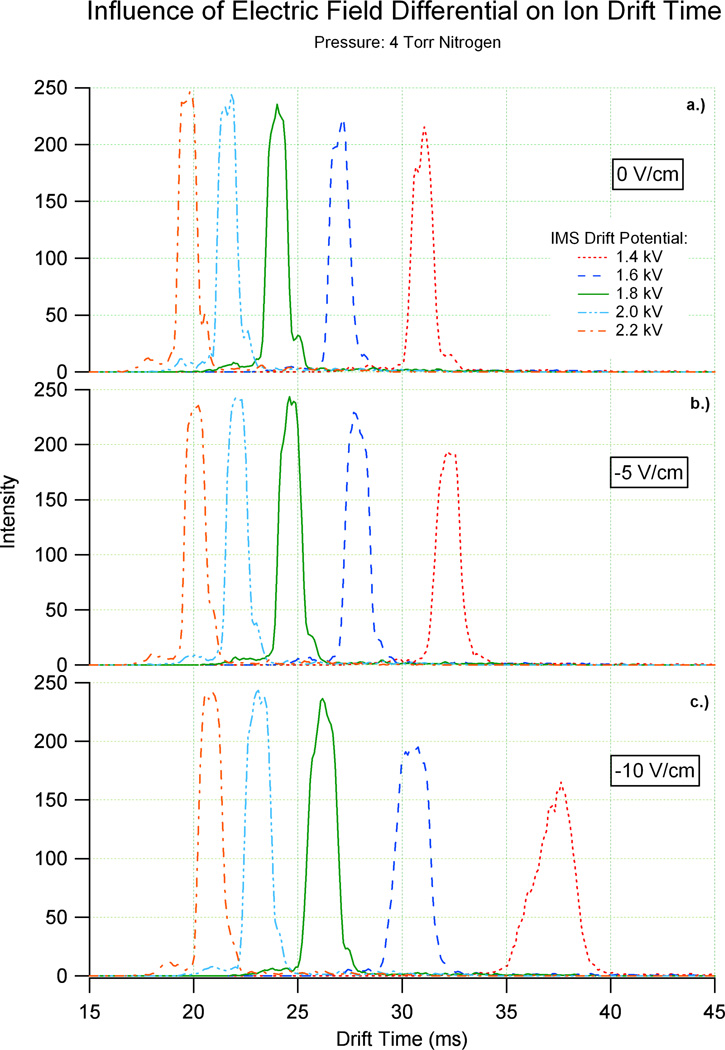
Figure 2.
These graphs illustrate the difference in drift time for an ion when the drift cell and rear ion funnel are at a) the same field, b) the drift cell is 5 V/cm higher than the ion funnel and c) the drift cell is 10 V/cm higher than the ion funnel. The small features in each ATD represent less abundant (bradykinin)2+ conformations.

