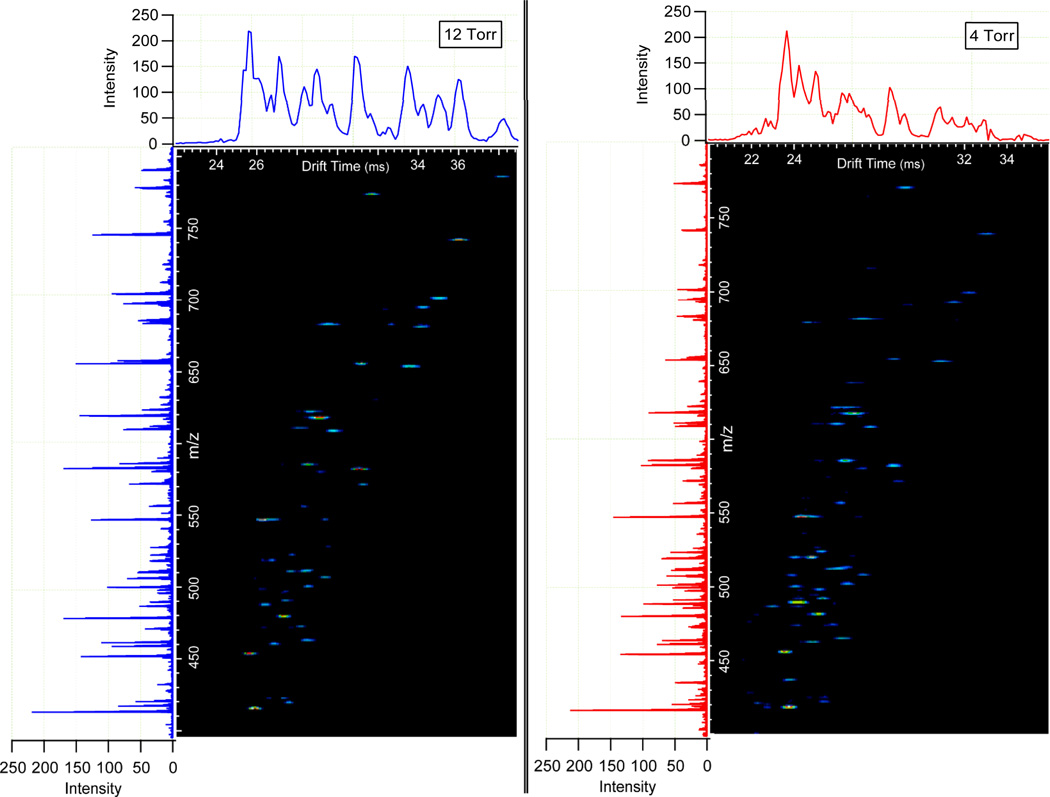
Figure 4.
A section of a nested BSA tryptic digest spectrum taken at 12 Torr (left) and 4 Torr (right) where drift time is displayed on the x-axis and m/z on the y-axis. The total ion chromatograms are displayed above the nested spectra and the integrated mass spectrum for each is on the left. The smaller spot sizes of the 12 Torr nested spectrum indicate the increase in resolving power from the 4 Torr separation.

