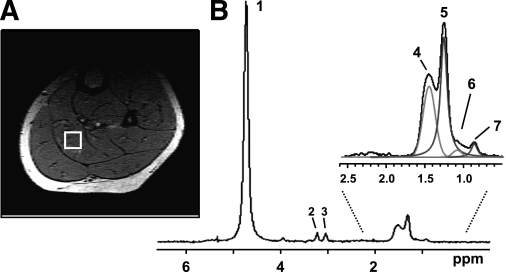
FIG. 3.
A localized muscle 1H spectrum acquired from a specific region (voxel) within the soleus muscle. A: The selected voxel is outlined by a white box superimposed on a cross-sectional MRI image of the calf. B: Multiple lipid peaks can be resolved enabling the quantification of IMCL and EMCL. Peak 1: water; peak 2: choline-CH3; peak 3: creatine-CH3; peak 4: EMCL-CH2; peak 5: IMCL-CH2; peak 6: EMCL-CH3; and peak 7: IMCL-CH3.

