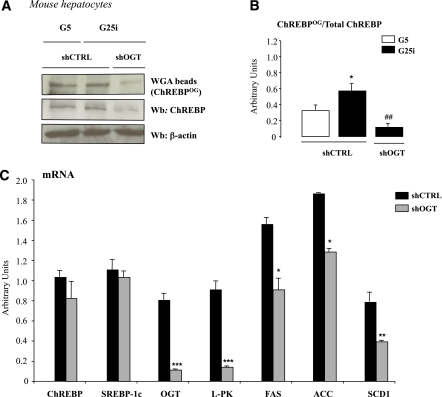
FIG. 6.
OGT silencing decreases ChREBPOG levels and ChREBP-target gene expression in primary mouse hepatocytes. Mouse hepatocytes were incubated under low glucose concentrations (G5) and adeno-infected with 5 pfu/cell of control (shCTRL) or shOGT adenovirus for 5h. Cells were then incubated for 24 h under low glucose (G5) or high glucose concentrations plus insulin (G25i). A: ChREBPOG were obtained by WGA binding. Representative Western blots (Wb) of O-GlcNAcylated and total ChREBP protein are shown. n = 5 independent cultures. B: Quantification of the ratio of ChREBPOG compared with total ChREBP content is shown. Data are means ± SEM. n = 5 independent cultures. *P < 0.05 compared with G5 conditions; ##P < 0.01 compared with shCTRL conditions (G25i). C: Quantitative RT-PCR analysis of ChREBP, SREBP-1c, OGT, L-PK, ACC, FAS, and SCD1. *P < 0.01; **P < 0.005; ***P < 0.001 compared with shCTRL (G25i). Data are means ± SEM. n = 5 independent cultures. (A high-quality color representation of this figure is available in the online issue.)

