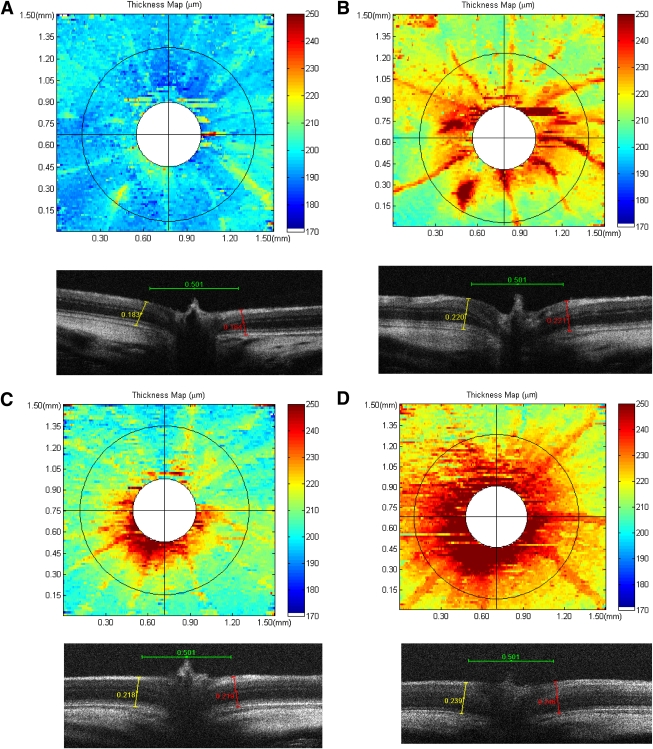
FIG. 8.
Representative false-color topographic thickness maps of rat retina obtained by SD-OCT illustrating the effect of exogenous PK on the retina at 24 h after injection into the vitreous. Thickness maps were generated by using an edge-detection algorithm to identify the RPE and ILM layers in each horizontal B-scan of a rectangular retinal volume. Thickness was calculated as a difference between points on the RPE and ILM along an entire B-scan. Baseline and 24 h after PK injection thickness maps are shown for nondiabetic (A and B) and diabetic (C and D) rats, respectively. Corresponding B-scans bisecting the ONH from each map are shown below. Exogenous PK increased retinal thickness uniformly across the retina in both nondiabetes and diabetes and induced vascular dilation, as indicated by increased vessel thickness. B-scans illustrate an increase in retinal thickness at the ONH rim at baseline and enhanced thickness at the ONH induced by PK at 24 h after injection. (A high-quality digital representation of this figure is available in the online issue.)

