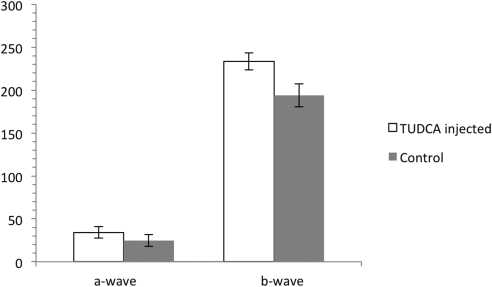
Figure 1.
ERG a- and b-wave amplitude results for rd10 mice treated with TUDCA versus rd10 mice treated with vehicle (NaHCO3). Rd10 injected with TUDCA every 3 days from P6 to P38 (n = 4). Rd10 controls injected with vehicle on the same schedule (n = 5). The difference in b-wave amplitudes is statistically significant at P30 (P = 0.039) by paired t-test. The difference in a-wave amplitude did not reach statistical significance. Error bars, SEM.

