Figure 3.
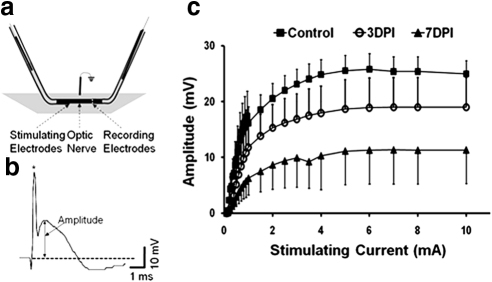
Electrophysiologic measurements of CAP were performed using suction electrodes. (a) The optic nerve was loosely inserted into a glass stimulating electrode (left) and tightly “sucked” into the recording electrode. (b) A typical CAP trace where the amplitude was determined as the voltage difference between the baseline (dotted line) at the beginning of the stimulation artifact (*) and the most positive peak of the trace. (c) Input/output curves of CAP amplitude from increasing stimulation intensities, where the CAP amplitude gradually increased until maximal amplitudes in each group reached a plateau. The 50% amplitude as well as the maximal CAP amplitudes was significantly decreased at 3DPI. Further significant decrements were observed at 7DPI.

