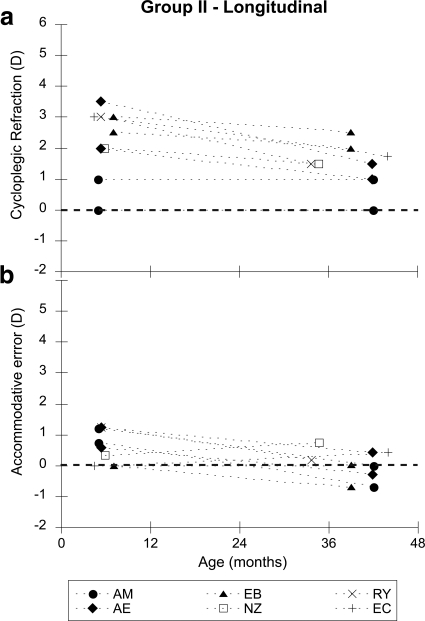
Figure 2.
Data from group II, who were tested at both 6 months and 2 or 3 years of age. Each symbol represents a different subject and is labeled with their initials. The filled symbols represent subjects with astigmatism (two principal meridia). (a) The refractive error of the principal meridia of their least hyperopic eye is plotted as a function of age. (b) The accommodative error of those meridia is plotted as a function of age.

