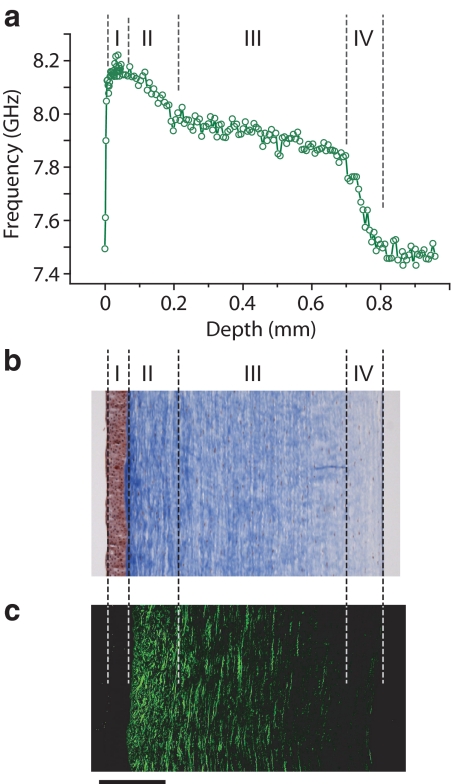
Figure 3.
Comparison of Brillouin elasticity and structural images. (a) Brillouin depth profile of the entire cornea including the epithelium (I), anterior stroma (II), posterior stroma (III), and the innermost region (IV). (b) Masson's trichrome–stained image of 5-μm-thick cornea section. (c) An SHG image of 5-μm-thick cornea section. Scale bar, 200 μm.

