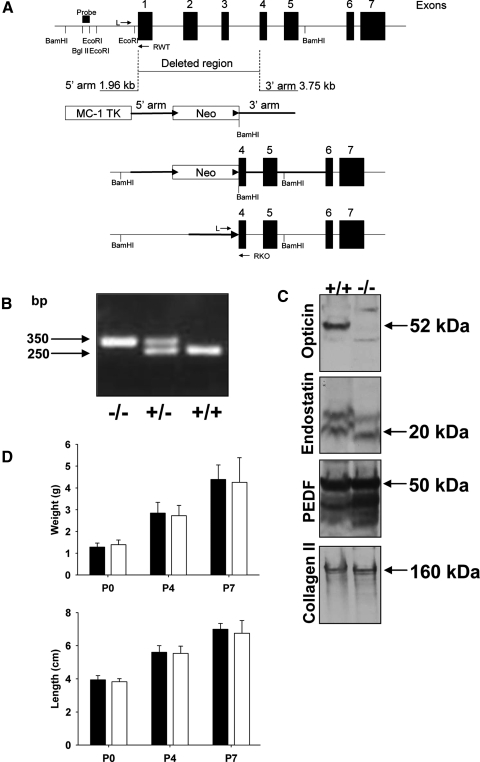
Figure 1.
Generation of Optc−/− mice. (A) Genomic structure of mouse opticin indicating region deleted in Optc−/− mice and the arms obtained by PCR of an opticin containing BAC clone. BamHI, EcoRI, and BglII restriction sites and the position for Southern-blotting analysis probe are indicated. The second diagram shows the targeting vector including MC-1 TK cassette for negative selection, 5′ and 3′ arms for recombination, and neomycin (Neo) cassette flanked with two floxed sites (arrowheads). The third diagram shows the inserted neomycin cassette within the targeted gene and the bottom diagram shows the deleted gene after Cre recombination to remove the neomycin cassette. Position of genotyping primers (L, RWT, and RKO) are shown on the top and bottom panels. (B) Electrophoresis separation of genotyping PCR products showed knockout (−/−), heterozygous (+), and wild-type (+/+) genotypes with their respective sizes in bp. (C) Extracts of Optc+/+ and Optc−/− mice whole eyes were separated by SDS-PAGE and analyzed by Western blotting with antibodies to opticin, endostatin, PEDF, and collagen type II; the arrows indicate the positions of these components with the corresponding molecular weight. Equal sample loading was checked by comparing the band intensities after collagen type II detection. (D) The growth of Optc+/+ (black bars) and Optc−/− (white bars) mice was compared by measuring weight and length at different postnatal stages (n = 26 [P0], n = 65 [P4], and n = 68 [P7] for Optc+/+ and n = 11 [P0], n = 78 [P4], and n = 34 [P7] for Optc−/−). No significant difference in either of the parameters could be seen between the animals (P = 0.178 at P0, P = 0.092 at P4, P = 0.866 at P7 for weight, and P = 0.182 at P0, P = 0.327 at P4, P = 0.375 at P7 for length).

