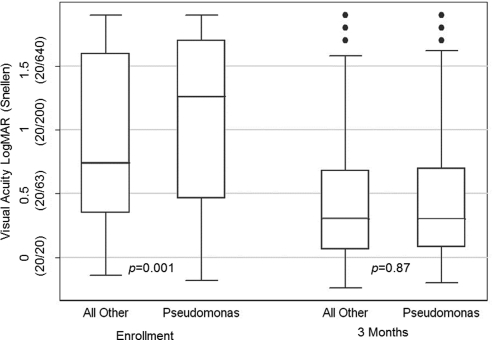
Figure 1.
Visual acuity comparison of P. aeruginosa and all other bacterial ulcers at enrollment and 3 months. The line in the middle of each box represents the median, and the lower and upper bounds of the box represents the 25th and 75th percentiles, the span of which is the interquartile range (IQR). Whiskers extend to the lowest data point within 1.5× IQR below the 25th percentile and to the highest data point within 1.5× IQR above the 75th percentile. Individually plotted points represent outliers or values falling outside the whiskers. P values were obtained by rank sum test.

