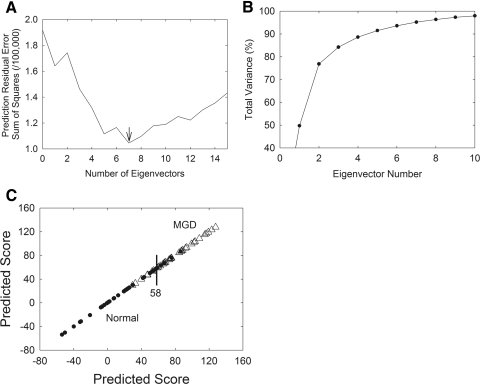
Figure 4.
(A) A PRESS plot was used to choose the proper number of eigenvectors for PCA analysis. The smaller the PRESS value, the better the model is able to predict the contributions of the calibrated constituent MGD/normal scores. (B) The contribution of each eigenvector can be evaluated by plotting the eigenvector number versus the percentage of total variance. (C) (•) Mn. (▵) Md. The training set used in PCA discriminated between Mn and Md, with an accuracy of 86%. A score below 58 was considered normal and above 58 MGD.

