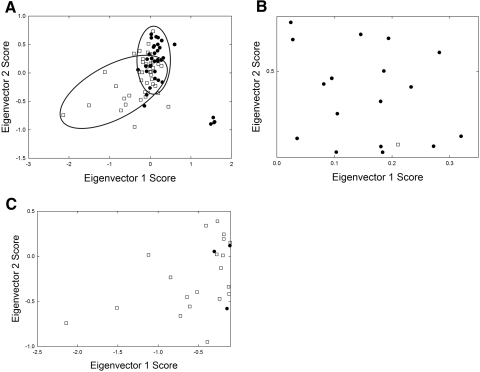
Figure 5.
The scores for an eigenvector plotted against the scores of another eigenvector were used to determine which eigenvectors were the most important modeling components. (A) Eigenvectors 1 and 2 grouped the Mn and Md spectra into two classic elliptical Mahalanobis boundaries. (B) A negative score for eigenvectors 1 and 2 favored Mn. (C) A positive score favored Md. (•) Md, (□) Mn.

