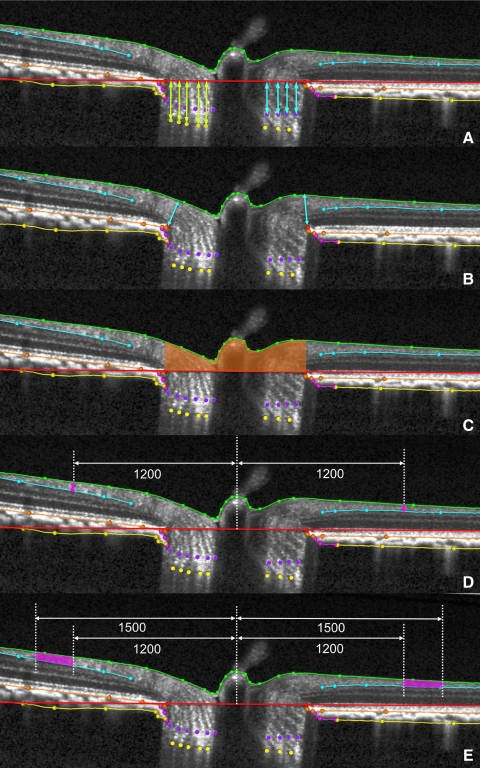
Figure 5.
ONH and RNFL parameter definitions as measured within each B-scan. (A) PLCS depth (light yellow-green arrows) was measured at each delineated PLCS point as the perpendicular distance from the neural canal opening (NCO) reference plane (red line in the cross-section). ALCS depth (light blue arrows) was measured at each delineated ALCS point as the perpendicular distance from the NCO reference plane. (B) Rim width (light blue arrows) was measured at each delineated NCO point (red) as the minimum distance to the ILM (green B-spline line). (C) Rim area was measured within each B-scan as the area contained within the NCO reference plane section line (red), the ILM (green B-spline line) and perpendicular projections from each NCO point (red). These projections are the left and right borders of the rust-colored area. (D) RNFLT 1200 was measured on either side of the canal at ILM points that were 1200 μm from the centroid of the 80 delineated NCO points (the NCO centroid). Central white vertical dotted line: projection of the NCO centroid. RNFLT at each ILM point was the minimum distance (pink arrow) between the ILM and the posterior (outer) RNFL boundary (light blue B-spline line). (E) RNFL area (pink) was generated on either side of the canal from the area contained within the 1200- and 1500-μm ILM point perpendiculars (peripheral vertical dotted white lines), the ILM (green B-spline line), and the posterior (outer) RNFL boundary (light blue B-spline line).

