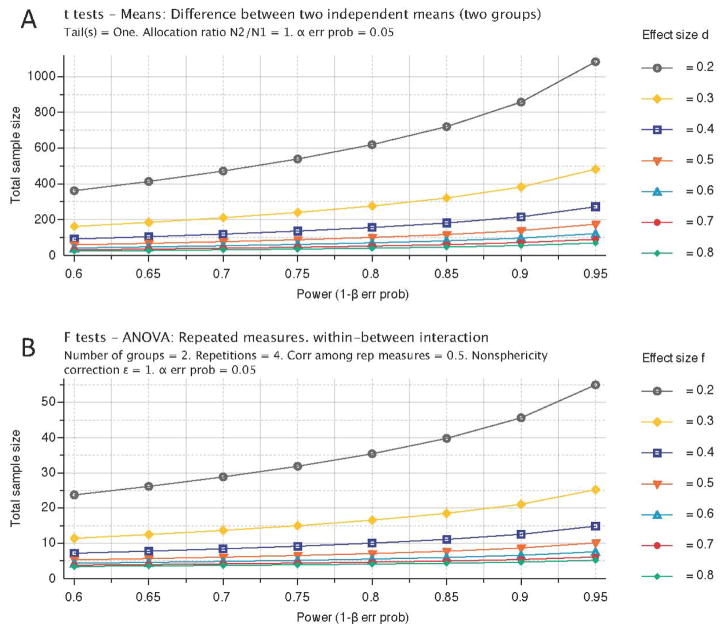
Figure 2.
Reducing animal numbers through serial assessments. A comparison of T- and F-test statistics using power calculations (generated using G*Power software 3.0.10, freely available at www.psycho.uni-duesseldorf.de/aap/projects/gpower/) indicate that an almost 20-fold reduction in sample size can be achieved with a similar effect size (0.3) by repeatedly (3×) measuring the same subjects. For instance, to compare two groups (i.e. treated versus untreated) at a single time point with an effect size of 0.5 at the 95% power level, a total sample size of 88 subjects is needed. In contrast, if there are 3 serial measurements on these subjects using a repeated measure Analysis of Variance (ANOVA), a total sample of only 12 is required. The variance used for the power calculations here is based on the Modo et al. (Modo et al. 2009) MRI lesion volume data that yielded an effect size of 0.5 at the final time point.

