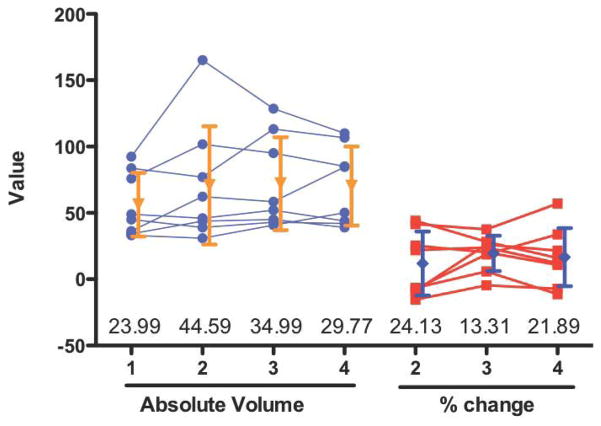
Figure 3.
Reduction of group variability through serial measurement. If baseline information can be acquired prior to animals undergoing any treatment, this data can be used to calculate the percentage (%) change of these animals at later time points. For instance, here MRI-based lesion volume data (expressed as mm3 for absolute and % change) from Modo et al. (Modo et al. 2009) is presented for 8 animals at 4 time-points. The standard deviation for % change measures is reduced, as the baseline intra-animal variability is accounted for (values at the bottom of the graph indicate the standard deviation for each time point). The reason for this reduction in variability is that % change removes the initial distance between animals (i.e. initial intra-animal variability). Removing this intra-animal variability will increase the power of a statistical comparison (i.e. reduces the number of animals needed for each group).

