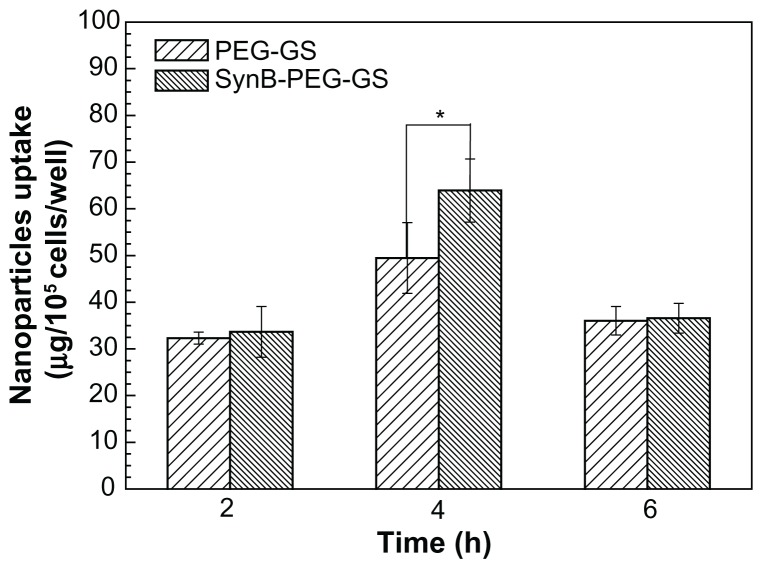
Figure 5.
Amounts of SynB-PEG-GS and PEG-GS taken up by brain capillary endothelial cells detected by inductively coupled plasma mass spectrometry.
Notes: P < 0.05 indicates a statistically significant difference; means ± standard deviations are indicated (n = 4).
Abbreviations: SynB-PEG-GS, SynB-PEG nanoparticles decorated with gelatin-siloxane; PEG-GS, PEG-gelatin-siloxane nanoparticles.

