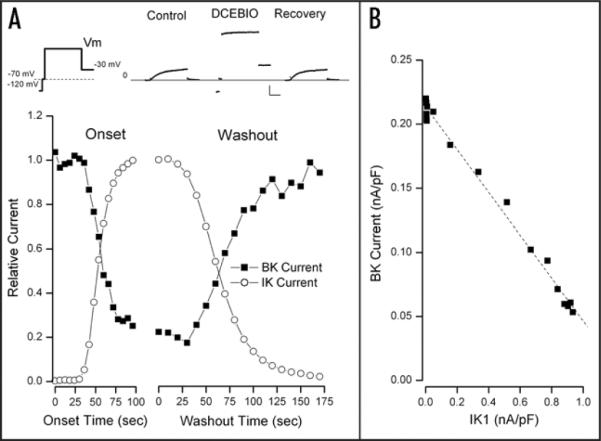
Figure 1.

Time course of IK1-induced inhibition of BK current. This, and all cells were patched with a solution containing 80 nM free Ca2+. (A) Top: currents recorded with the pulse protocol illustrated on the left with the main test potential at +50 mV. Cells were held at −70 mV; a 5 msec step to −120 mV was followed by a 5 msec return to the −70 mV holding potential. This brief return to −70 mV serves to monitor for leak currents since −70 mV is slightly depolarized from the K+ equilibrium potential, K channel current will be positive at this voltage and leak current will be negative. The voltage protocol continues with a 70–100 msec pulse to the test potential followed by a step to −30 mV. The currents resulting from this protocol are shown before (Control) during (DCEBIO) and after (Recovery) application of 10 μM DCEBIO. Lines serve only to connect the data points and have no significance. Calib: 0.5 nA/pF, 20 msec. Main: IK1 (○) and BK (■) current components (see Methods) normalized to their maximum average values and shown during application (Onset) and washout of 10 μM DCEBIO. (B) The amount of BK current at the test voltage of +50 mV as a function of the IK1 current at this same potential. The dashed line is from the fit of a simple linear relationship between these two parameters (see text for details).
