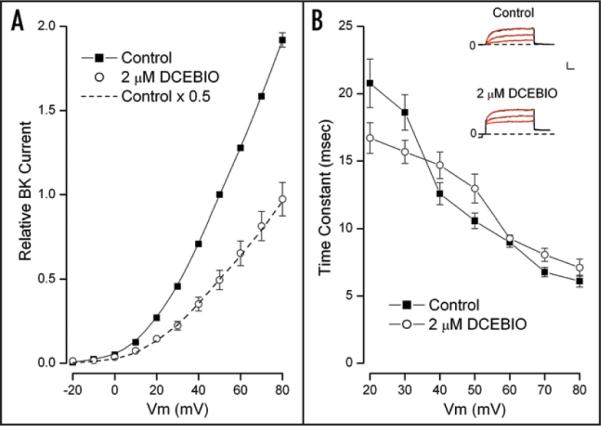
Figure 5.

BK current-voltage relation and gating kinetics in 2 μM DCEBIO. (A) Time dependent BK current component at the indicated potentials in the absence (■) and presence (○) of 2 μM DCEBIO. Mean values from 5 cells with standard error limits. The data have been normalized to the control BK current value at +50 mV. The dashed line is the control data scaled by a constant factor of 0.5. (B) Inset: raw current data in response to voltage steps to 30, 50 and 70 mV in the absence (Control) and presence of 2 μM DCEBIO. The red lines are single exponential time function fits to the data. Calib: 0.25 nA/pF, 10 msec. Main: mean values of the fitted time constants with standard error limits at the indicated membrane potentials in the absence (■) and presence (○) of 2 μM DCEBIO.
