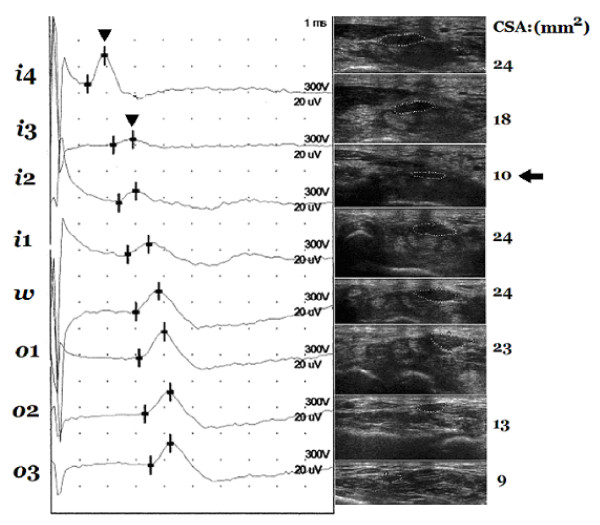
Figure 4.
An example of "positive-site" between i4 and i3 corresponding to the relatively smaller cross-section area (CSA) at i2. The peak latencies (arrowhead) at i4 and i3 are 1.9 ms and 2.9 ms, respectively, and the difference between them is 1.0 ms, i.e. >0.4 ms. The CSA measured at i2 (arrow) is smaller than those measured at nearby levels. Markers of the 8-point: i4, i3, i2, i1, w, o1, o2, and o3.

