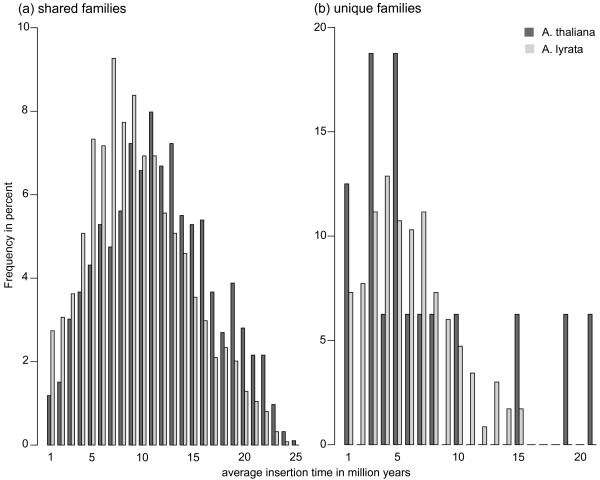
Figure 3.
Average insertion time distribution for each family. The average insertion time was calculated based on the average nucleotide divergence between all copies of one family. (a) Histogram for shared families; (b) histogram for unique families. The percentage of families with a given age are represented by dark grey bars for A. thaliana and light grey bars for A. lyrata. The mean average insertion time for shared families is 11.1 Mya for A. thaliana and 9 Mya for A. lyrata, respectively. For unique families it is 6.7 and 5.5 Mya, respectively. The mean of the average insertion time for shared families is significantly smaller in A. lyrata (P <10-15, Wilcoxon rank sum test). Notice the different scales for shared and unique families.

