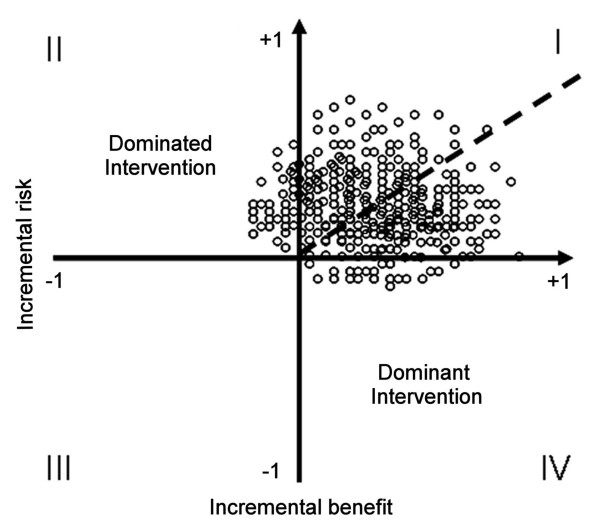
Figure 1.
Risk-benefit plane showing a hypothetical conjoint risk-benefit analysis. In this hypothetical example, each point represents a joint risk-benefit observation calculated from a replication obtained from the Monte Carlo simulation. The percentage of the observations lying below the risk-benefit acceptability threshold (solid line) represents the probability of the intervention being net-beneficial for that specific threshold. It can be noted that a higher value of the threshold (i.e. a higher risk acceptance) will result in a higher probability of the intervention being net risk-beneficial.

