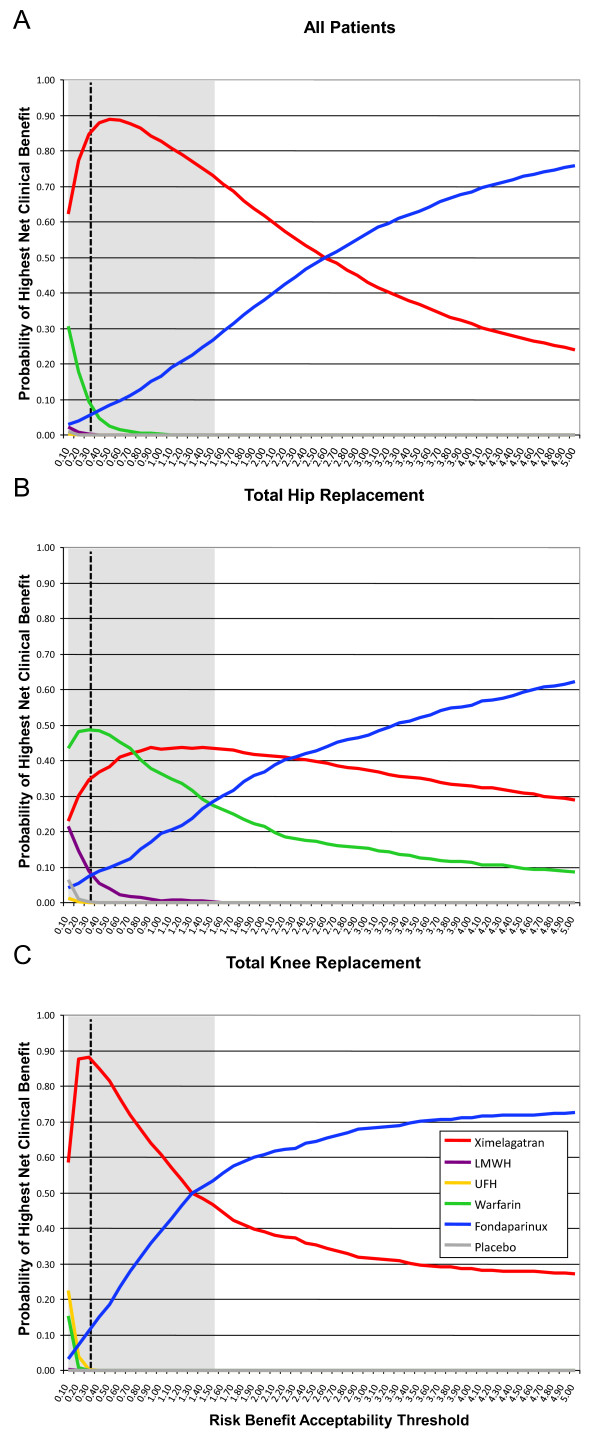
Figure 4.
Net clinical benefit probability curves for anticoagulants used in the prevention of venous thromboembolism in all patients undergoing orthopedic surgery (A), total hip replacement (B) and total knee replacement (C). The curves plot the probability that each drug has of providing the highest net clinical benefit -and consequently having the best risk-benefit profile- for each value of the risk-benefit acceptability threshold. The reference value is shown as the vertical dashed line with the 95% confidence interval shown as the shadowed area. Note that the probabilities change at different values of risk acceptance and that at each value the probabilities add up to one.

